A complete platform to centralise rates, bookings and channels
CRS
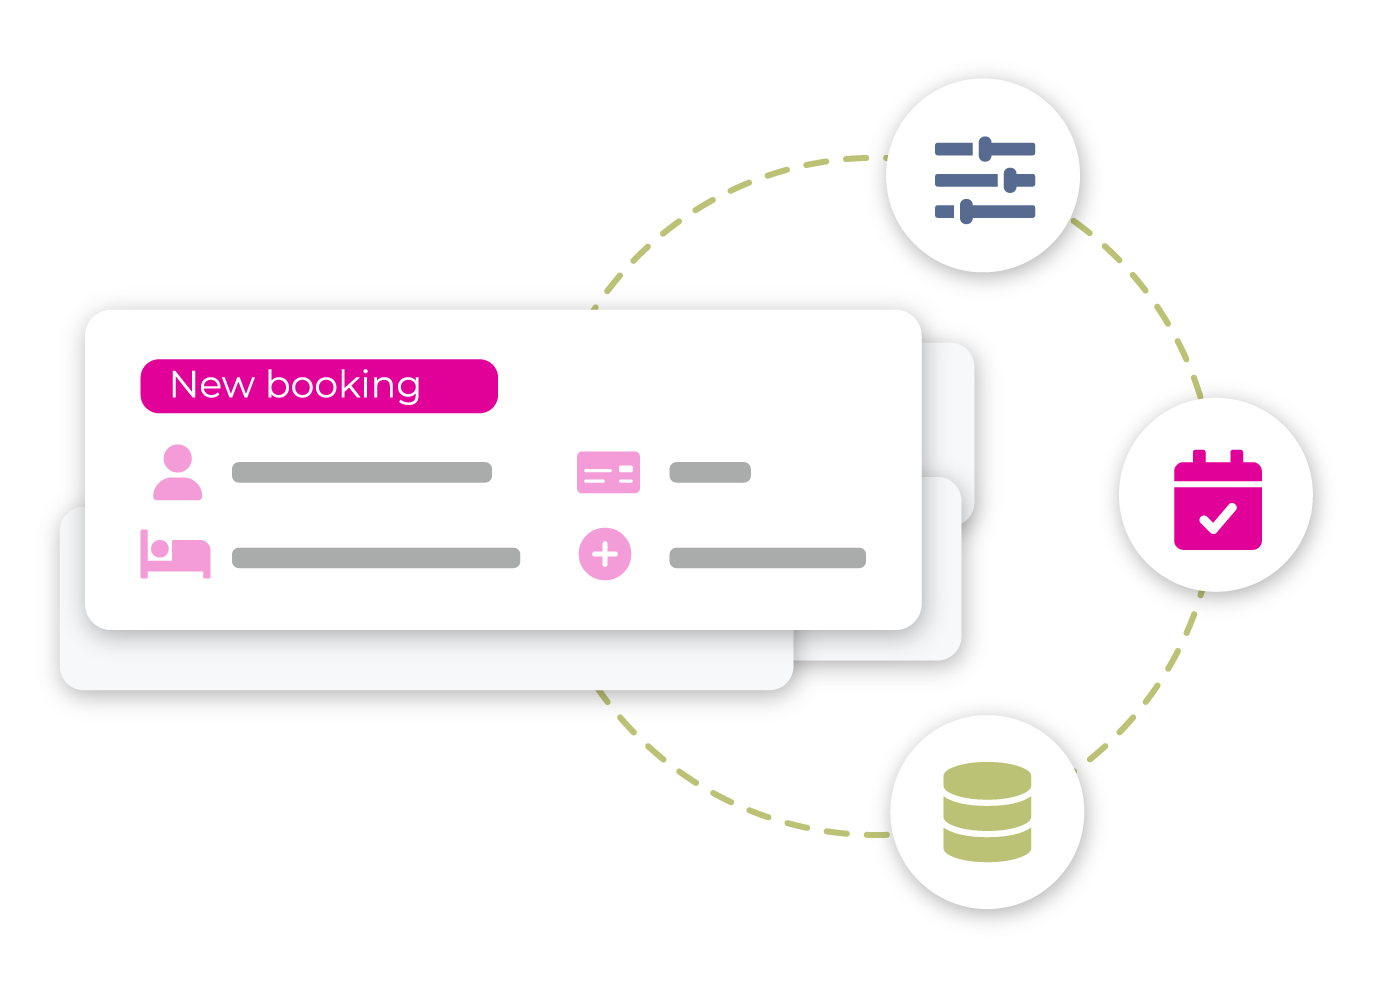
Our CRS, custom developed for independent hotels, allows you to centrally manage rates and bookings on all channels, from the official website to OTAs and GDS (Global Distribution Systems). Everything is updated in real time to reduce manual interventions, reduce the risk of overbooking and improve the user experience.

Our CRS, custom developed for independent hotels, allows you to centrally manage rates and bookings on all channels, from the official website to OTAs and GDS (Global Distribution Systems). Everything is updated in real time to reduce manual interventions, reduce the risk of overbooking and improve the user experience.

Your sales channels, all connected
The CRS ensures you real-time connections with other Blastness and/or third-party systems:
-
Booking Engine for direct online room sales through your website
-
CRM/CRO for managing your bookings
-
Channel Manager for managing your online portals and Tour Operators/Wholesalers with XML connection
-
GDS Manager and GDS Distribution to be visible in the terminals of agencies around the world directly or through representatives/affiliations (Leading Hotels of The World, Small Luxury Hotels, Relais & Chateaux, Preferred Hotels and Resorts, etc.)
Do you want to maximise direct bookings?
Blastness offers an entire ecosystem of solutions designed to increase visits to your official website, maximise direct sales and turn every potential customer into a confirmed booking. Discover all our products and services designed to grow your business, simply and effectively.
